Import Stock Prices to Google Sheets: A Step-by-Step Guide

LAST UPDATED
June 6, 2024
Jason Gong
TL;DR

Use GOOGLEFINANCE to import stock prices into Google Sheets.

By the way, we're Bardeen, we build a free AI Agent for doing repetitive tasks.

If you're tracking stocks, you might love our GPT in Spreadsheets feature. It can automate data entry and analysis, saving you time and effort.

Tracking stock prices is essential for investors and financial analysts. Google Sheets offers a powerful built-in function called GOOGLEFINANCE that allows you to import real-time and historical stock data directly into your spreadsheets. In this step-by-step guide, we'll walk you through how to use the GOOGLEFINANCE function to fetch stock prices, set up your spreadsheet for optimal data organization, and explore advanced tips to enhance your financial analysis.

Introduction to GOOGLEFINANCE in Google Sheets

GOOGLEFINANCE is a powerful function in Google Sheets that allows you to import real-time and historical stock price data directly into your spreadsheets. With GOOGLEFINANCE, you can:

  • Fetch current stock prices with a slight delay of up to 20 minutes
  • Retrieve historical stock data for specific date ranges
  • Access various attributes such as price, volume, high, low, and more

The general syntax for the GOOGLEFINANCE function is:

GOOGLEFINANCE(ticker, [attribute], [start_date], [end_date|num_days], [interval]

  • ticker: The ticker symbol for the security (e.g., "NASDAQ:GOOG")
  • attribute: The specific data point to fetch (e.g., "price", "volume")
  • start_date & end_date|num_days: Optional parameters for historical data
  • interval: The frequency of returned data ("DAILY" or "WEEKLY")

For more advanced features, consider using GPT for Google Sheets to automate and analyze your data efficiently.

Setting Up Your Spreadsheet for Stock Data

To set up your Google Sheet for importing stock prices, follow these steps:

  1. Open a new Google Sheets spreadsheet
  2. In cell A1, enter the header "Ticker Symbol"
  3. In the cells below A1, list the ticker symbols for the stocks you want to track (e.g., "NASDAQ:GOOG", "NYSE:AAPL")
  4. In cell B1, enter the header "Attribute" (e.g., "Price", "Volume", "High", "Low")
  5. In the cells below B1, specify the corresponding attribute for each stock
  6. Format the cells as needed for clarity (e.g., bold headers, currency formatting for prices)

Defining the stock symbols and data attributes is crucial for effectively tracking stock performance. Some common attributes to consider include:

  • Price: The current or closing price of the stock
  • Volume: The number of shares traded
  • High: The highest price reached during the trading day
  • Low: The lowest price reached during the trading day
Save time by using Bardeen's integration with Google Sheets to automate data collection.

By organizing your spreadsheet with clear headers and specific stock symbols and attributes, you'll be ready to connect Google Sheets for data using the GOOGLEFINANCE function.

Fetching Real-Time Stock Prices

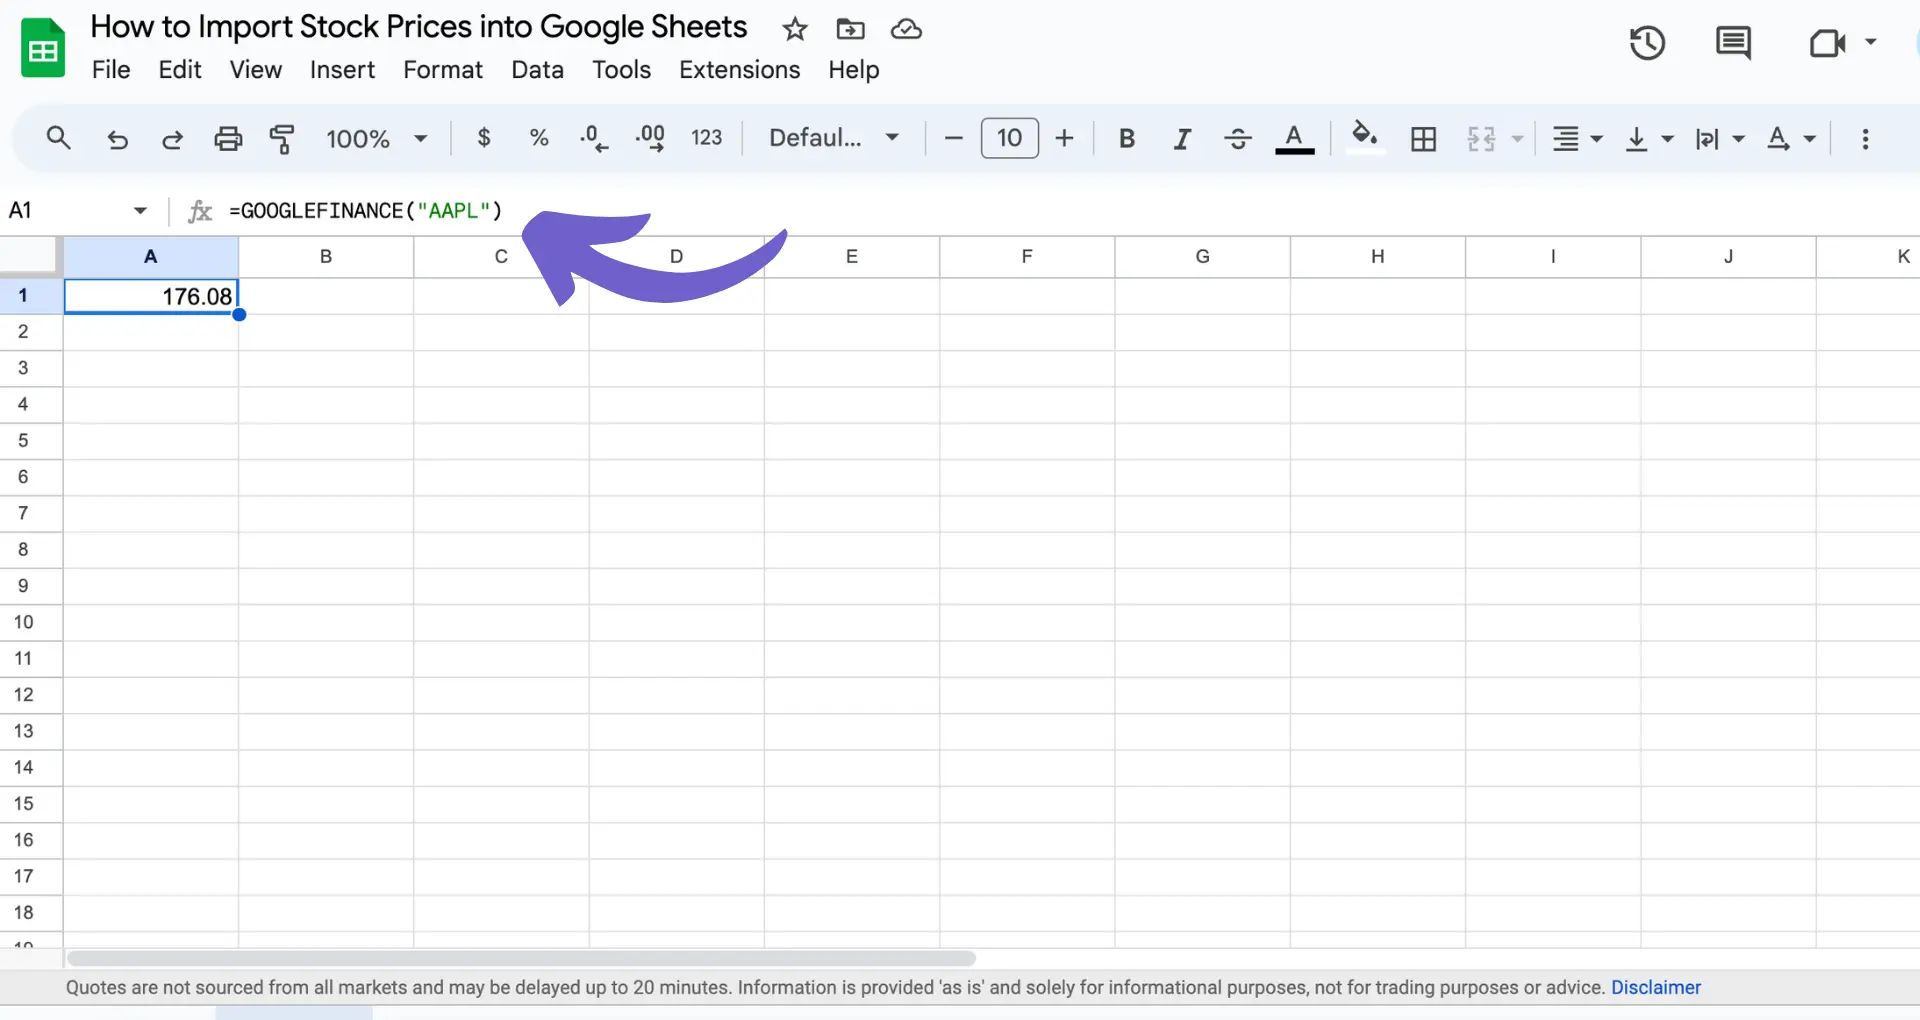
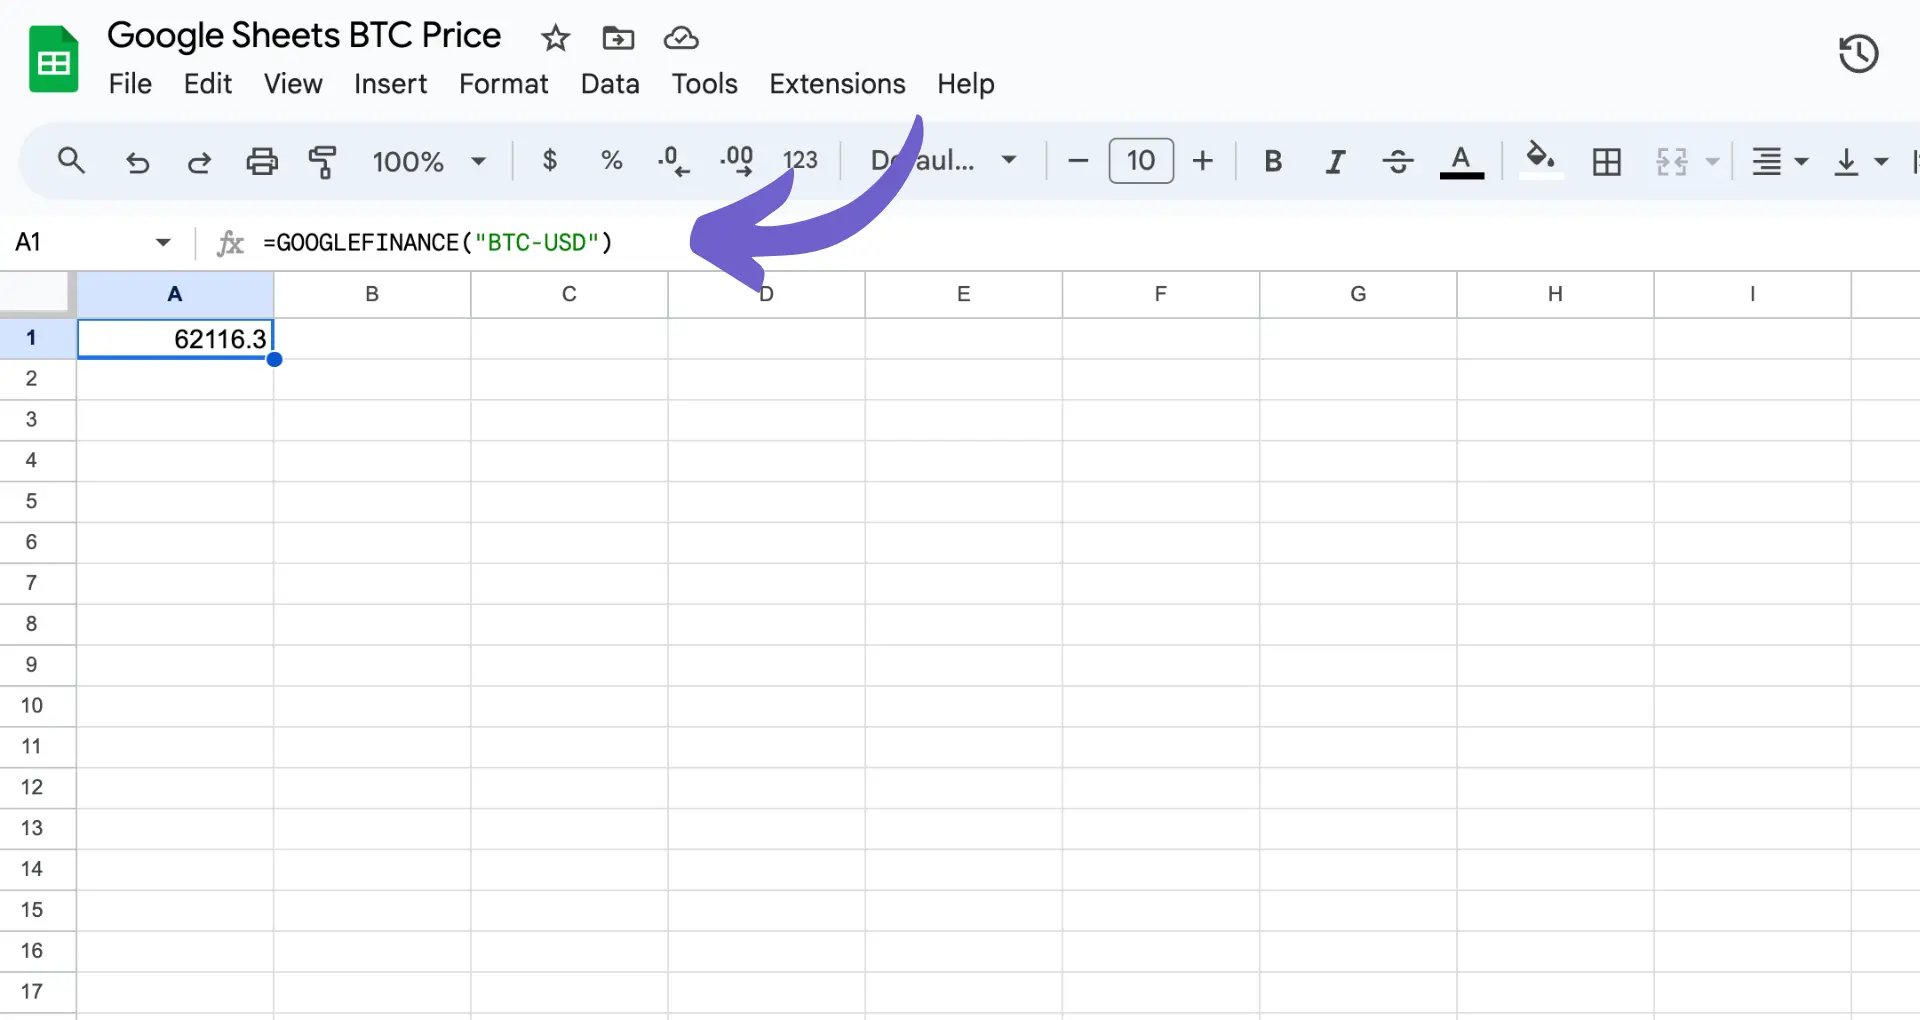
To fetch real-time stock prices in Google Sheets using the GOOGLEFINANCE function, use the following syntax:

=GOOGLEFINANCE("TICKER", "ATTRIBUTE")

Replace "TICKER" with the stock symbol (e.g., "NASDAQ:GOOG" for Google) and "ATTRIBUTE" with "price" to retrieve the current price. For example:

=GOOGLEFINANCE("NASDAQ:GOOG", "price")

Note that the GOOGLEFINANCE function provides real-time stock prices with a 15-20 minute delay. This delay is important to consider when making financial decisions based on the data. Connect Microsoft Excel to automate further.

To pull data for multiple stocks in a single spreadsheet:

  1. Create a list of ticker symbols in one column
  2. In the adjacent column, use the GOOGLEFINANCE function with the cell reference for each ticker symbol
  3. Drag the formula down to apply it to all ticker symbols

To refresh the data dynamically, set the spreadsheet to update automatically:

  1. Go to "File" > "Spreadsheet settings"
  2. Under "Recalculation", choose "On change and every minute" or "On change and hourly"

This ensures that the real-time stock prices are updated regularly without manual intervention. You can also enrich LinkedIn profiles in Google Sheets for more data.

Accessing Historical Stock Data

To retrieve historical stock data using GOOGLEFINANCE, you need to specify a date range using the start_date and end_date parameters. The function allows you to fetch data at daily, weekly, or monthly intervals. Here's the syntax:

=GOOGLEFINANCE("TICKER","ATTRIBUTE",start_date,end_date,"INTERVAL")

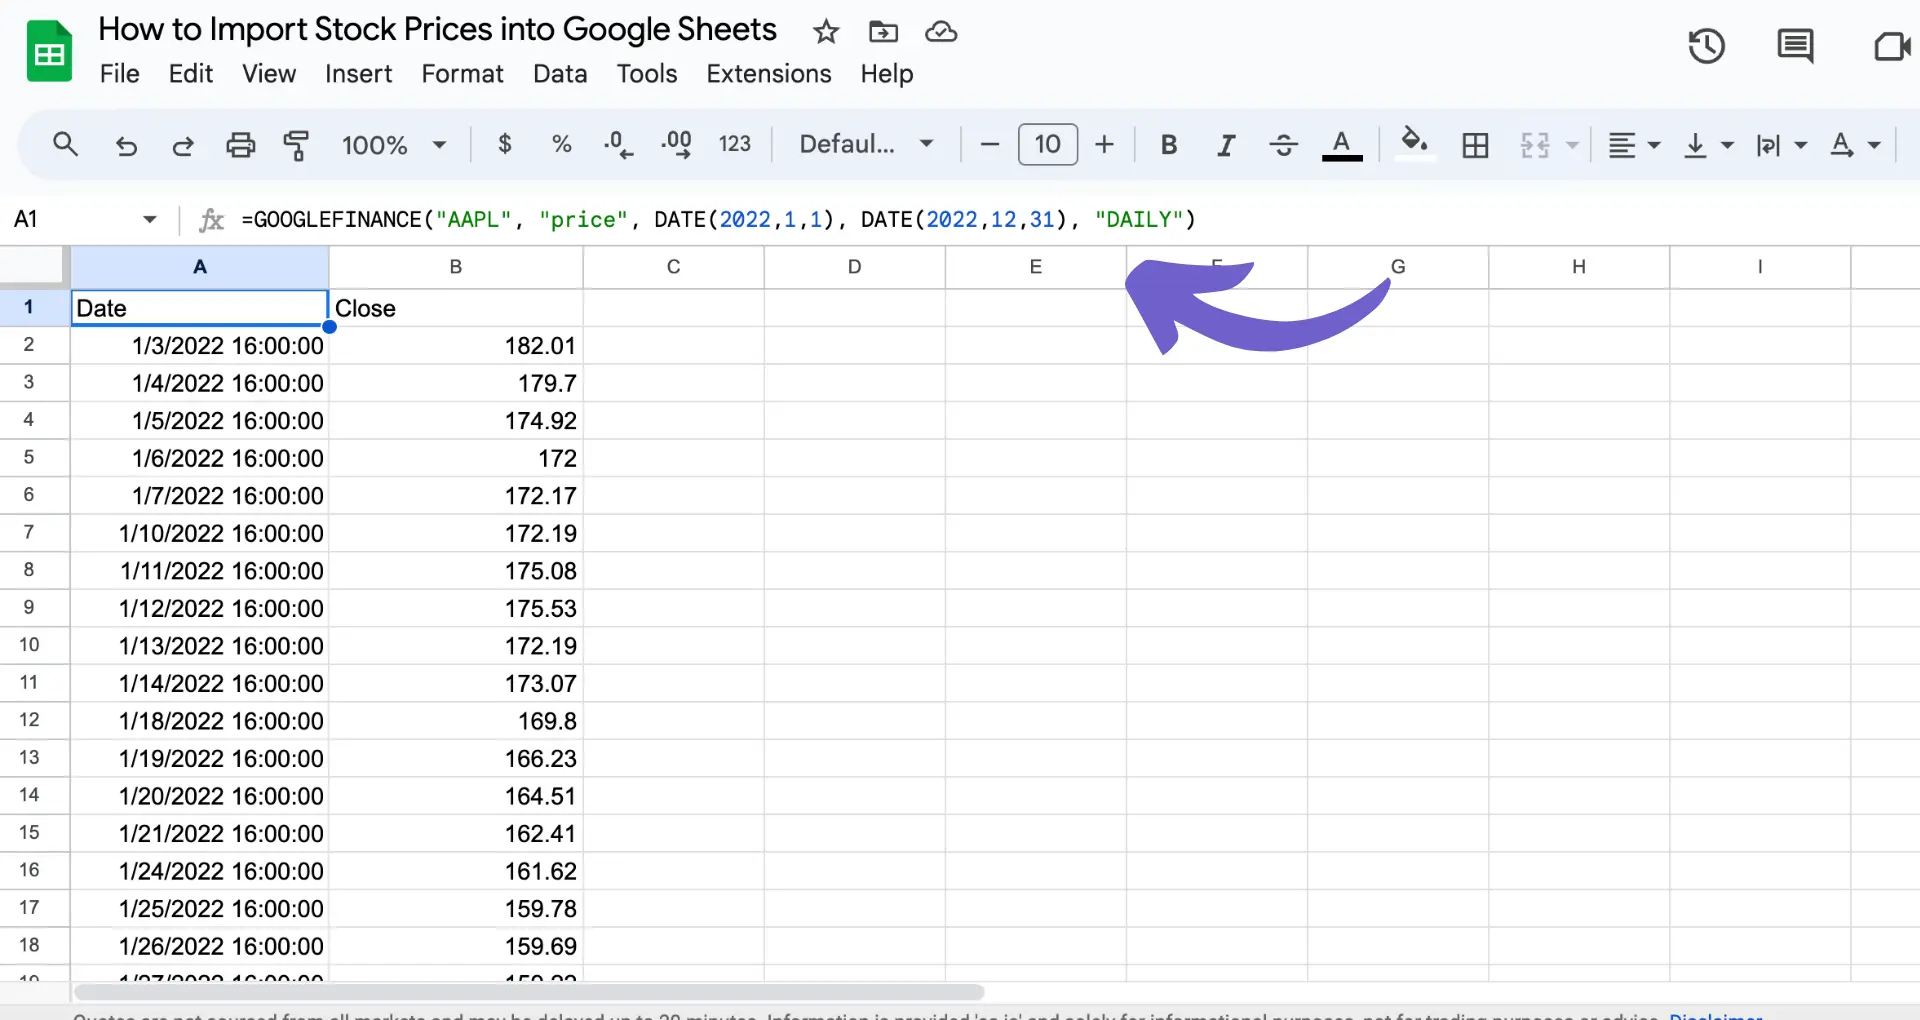
For example, to get the closing prices for Google (NASDAQ:GOOG) from January 1, 2022, to December 31, 2022, at a daily interval:

=GOOGLEFINANCE("NASDAQ:GOOG","close",DATE(2022,1,1),DATE(2022,12,31),"DAILY")

You can also specify the number of days instead of an end_date:

=GOOGLEFINANCE("NASDAQ:GOOG","close",TODAY()-30,TODAY(),"DAILY")

This retrieves the daily closing prices for the last 30 days.

To analyze stock performance over time:

  1. Set the start_date and end_date to cover the desired period
  2. Choose an appropriate interval (DAILY, WEEKLY, or MONTHLY)
  3. Use the retrieved data to calculate metrics like average price, volatility, or returns

By comparing historical data across different periods, you can identify trends, patterns, and potential investment opportunities. Scraping data from websites can also help in backtesting trading strategies and making informed financial decisions.

Save time on financial research with Bardeen's AI web scraper. Automate data collection and focus on making smart investment choices.

Advanced Tips and Common Pitfalls

To maximize the effectiveness of the GOOGLEFINANCE function, you can combine it with other Google Sheets functions for enhanced financial analysis. For example:

  • Use GOOGLEFINANCE with QUERY to filter and sort stock data based on specific criteria
  • Combine GOOGLEFINANCE with SPARKLINE to create mini-charts that visualize stock price trends
  • Integrate GOOGLEFINANCE with ARRAYFORMULA to automatically populate stock data for multiple ticker symbols

However, there are some common errors and pitfalls to watch out for when using GOOGLEFINANCE:

  1. Incorrect ticker symbols: Ensure you use the correct ticker symbol format (e.g., "NASDAQ:GOOG" for Google)
  2. Data limitations: GOOGLEFINANCE may not provide data for all securities or historical data beyond a certain point
  3. Slow updates: Data from GOOGLEFINANCE can be delayed by up to 20 minutes, and the spreadsheet must be manually refreshed

If you encounter a #N/A error, double-check your ticker symbol and parameters. You can also try using an alternative data source, such as the unofficial Yahoo Finance API, which can be accessed using the JSON Client in Coupler.io.

Remember, while GOOGLEFINANCE is a powerful function for importing financial data into Google Sheets, it has its limitations. Always verify the accuracy of the data and consider using multiple sources for critical financial decisions.

Automate Google Sheets with Bardeen for Smarter Finance

While manually importing stock prices into Google Sheets can be straightforward with functions like GOOGLEFINANCE, automating this process can save time, reduce errors, and allow for more complex data analysis. Bardeen offers a range of playbooks that can import not just stock prices but also related financial data directly into Google Sheets, making your financial analysis more efficient and comprehensive.

Here are examples of automations that can be built with Bardeen:

  1. Copy all Github issues to Google Sheets: This playbook automates the process of transferring issues from GitHub repositories into a Google Sheet, streamlining project management and bug tracking for development teams.
  2. Copy Google News for a keyword and save results to Google Sheets: Automatically extract Google News stories based on specific keywords into Google Sheets. Ideal for PR professionals and marketers tracking brand mentions or relevant industry news.
  3. Export Google Trends Data and Save to Google Sheets: This playbook scrapes Google Trends data for specified keywords and saves it directly to Google Sheets, offering valuable insights for SEO specialists and marketing analysts.

By utilizing these playbooks from Bardeen, users can significantly enhance their data management and analysis workflows within Google Sheets. Download the Bardeen app to start automating your financial analysis today at Bardeen.ai/download.

Contents
Monitor stock prices in Google Sheets with AI

Bardeen's AI Agent automates financial data entry and analysis in Google Sheets.

Get Bardeen free

Related frequently asked questions

Guide to Customizing Pipedrive Settings & Dashboard

Learn how to customize Pipedrive settings, dashboard, and web forms for a personalized CRM experience. Streamline your sales strategy effectively.

Read more
Guide to Installing ChatGPT Plugins in 5 Steps

Learn how to add plugins to ChatGPT Plus in 5 simple steps to enhance functionality by accessing external data and services.

Read more
Export Salesforce List Views to Excel: A Guide (2024)

Learn how to export Salesforce list views to Excel using built-in functionalities, Data Loader, dataloader.io, and Ascendix Search for efficient data analysis.

Read more
Export Salesforce Opportunities to Excel: A Guide in 7 Steps

Learn how to export Salesforce opportunities to Excel using data loaders, Excel add-ins, ODBC drivers, and more. Find the best method for your needs.

Read more
Customizing Pipedrive: Add Fields & Dashboards in 5 Steps

Learn how to customize Pipedrive with custom fields, dashboards, and settings. Tailor your CRM to fit your sales process and automate for efficiency.

Read more
Efficient Salesforce Campaign Member Import Guide in 5 Steps

Learn how to import campaign members into Salesforce in 5 steps, including data preparation and using import tools for effective campaign management.

Read more
how does bardeen work?

Your proactive teammate — doing the busywork to save you time

Integrate your apps and websites

Use data and events in one app to automate another. Bardeen supports an increasing library of powerful integrations.

Perform tasks & actions

Bardeen completes tasks in apps and websites you use for work, so you don't have to - filling forms, sending messages, or even crafting detailed reports.

Combine it all to create workflows

Workflows are a series of actions triggered by you or a change in a connected app. They automate repetitive tasks you normally perform manually - saving you time.

get bardeen

Don't just connect your apps, automate them.

200,000+ users and counting use Bardeen to eliminate repetitive tasks

Effortless setup
AI powered workflows
Free to use
Reading time
Thank you! Your submission has been received!
Oops! Something went wrong while submitting the form.
By clicking “Accept”, you agree to the storing of cookies. View our Privacy Policy for more information.