If you use HubSpot, you'll love our HubSpot integration. It automates data collection and analysis, saving you time and boosting efficiency.
Locating your website and traffic analytics reports in HubSpot is crucial for understanding your online performance and making data-driven decisions. In this step-by-step guide, we'll walk you through the process of accessing and utilizing HubSpot's Traffic Analytics tool to gain valuable insights into your website's traffic sources, visitor behavior, and conversion paths. By following these guidelines, you'll be able to effectively analyze your website's performance and optimize your marketing strategies accordingly.
Introduction
HubSpot's Traffic Analytics tool is a powerful resource for website owners and marketers looking to gain a deeper understanding of their online performance. By providing detailed insights into website traffic sources, visitor behavior, and conversion paths, this tool enables data-driven decision-making and optimization of marketing strategies.
In this step-by-step guide, we'll cover:
Accessing HubSpot's Traffic Analytics tool
Understanding traffic sources and their categorization
Customizing and filtering traffic reports
Utilizing advanced features for detailed analysis
Each section will provide specific, actionable instructions and insights to help you effectively navigate and utilize HubSpot's Traffic Analytics tool to its full potential. By following these guidelines, you can improve your website's performance and make informed decisions based on accurate data. For more tips on improving sales strategies, check out our guide on top sales prospecting tools.
Accessing HubSpot's Traffic Analytics Tool
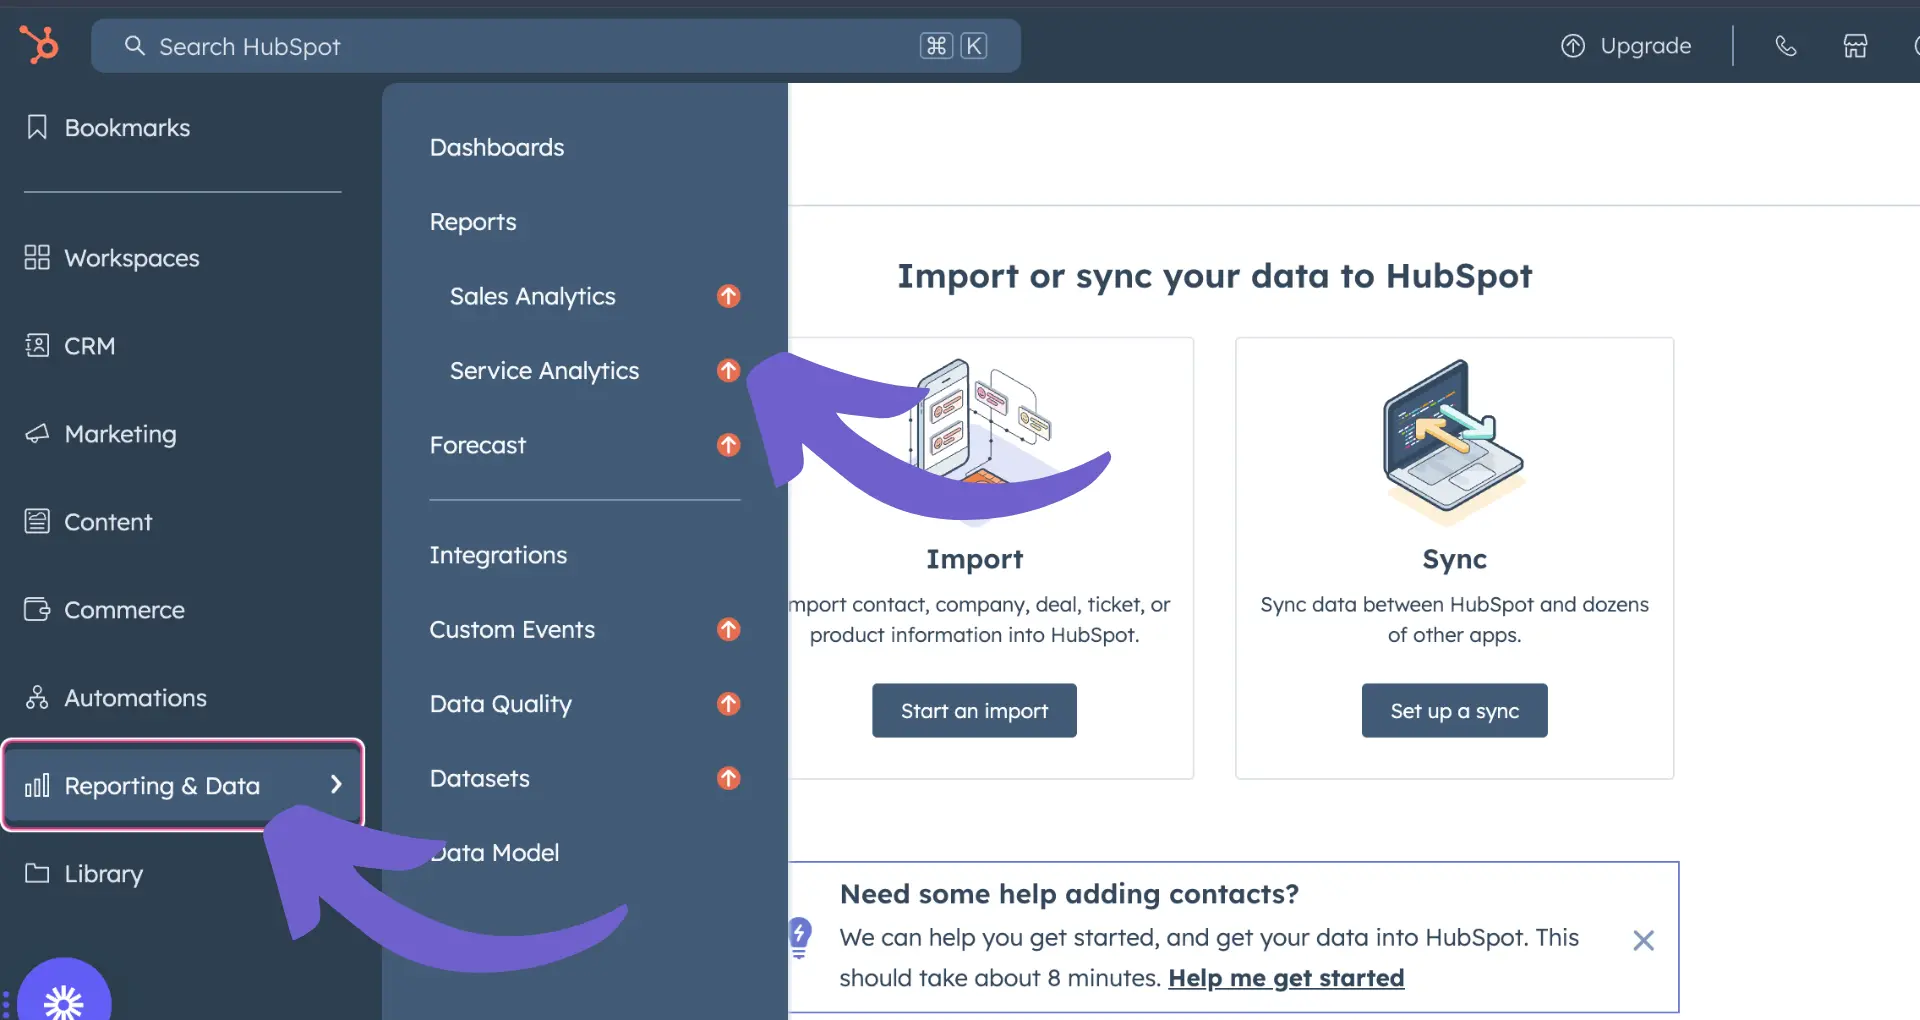
To start analyzing your website's traffic in HubSpot, navigate to the Traffic Analytics tool within your account:
In your HubSpot account, go to Reports & Analytics in the main navigation menu.
Click on Analytics Tools.
Select Traffic Analytics from the list of available tools.
The specific navigation path may vary slightly depending on your HubSpot subscription level (Marketing Hub Professional, Enterprise, or CMS Hub Professional or Enterprise). Once in the Traffic Analytics tool, you'll have access to various reports and dashboards to dive into your website's performance.
The default view is the Sources report, which breaks down your traffic by source (organic search, direct traffic, referrals, etc.). From here, you can explore other reports like:
Pages: Analyze the performance of individual website pages.
Topics: See how your content clusters are driving traffic.
Geographies: Understand where your visitors are coming from.
With the Traffic Analytics tool, you have a powerful resource to gain insights into your website's traffic sources, visitor behavior, and content performance. Tools like web scrapers can help to make data-driven decisions to optimize your website and inbound marketing strategy.
Tired of manual data extraction? Try Bardeen's AI web scraper to automate data collection and focus on more valuable tasks.
Understanding Traffic Sources and Their Categorization
HubSpot categorizes website traffic into various sources using specific URL parameters and referrer domains. This ensures accurate data segmentation for analyzing the effectiveness of your marketing efforts.
Here's how HubSpot determines the source of your traffic:
If the "utm_medium" parameter is "social" and the "utm_source" matches a recognized social network or the referring domain is a social media site, the traffic is categorized as Organic Social.
If the URL contains "adword", "ppc", "cpc", or the "gclid" parameter, the traffic is labeled as Paid Search.
If the "utm_medium" contains "paid", "ppc", or "cpc" and the "utm_source" matches a social network or the referring domain is a social media site, the traffic is classified as Paid Social.
If any UTM parameter is present and contains "email", the traffic is categorized as Email Marketing.
If a UTM parameter is present but doesn't contain "email", "adword", "ppc", or "cpc", the traffic falls under Other Campaigns.
If the referring domain is a search engine, the traffic is labeled as Organic Search.
If the referring domain doesn't match any of the above criteria, the traffic is classified as Referral.
If there is no referring domain or tracking URL, the traffic is categorized as Direct Traffic.
Understanding this methodology helps you accurately interpret your traffic data and make informed decisions based on the performance of each source. By leveraging data enrichment in your campaigns, you can ensure that traffic is properly attributed to the correct source, providing valuable insights into your marketing efforts.
Customizing and Filtering Traffic Reports
HubSpot's traffic analytics tool allows you to customize reports to focus on the metrics that matter most to your business. Here's how to tailor your reports:
Select the desired date range and frequency using the dropdown menus above the chart. This will apply to both the visualization and the raw data table.
Filter data by specific analytics views, such as country, subdomain, or URL path, by clicking the "Analytics view" dropdown and selecting a view or managing your custom views.
Customize the metrics displayed in the table below the chart by clicking "Edit columns" and selecting up to seven metrics to include.
To drill down into more granular data, use filters like:
These filters help you identify trends and insights specific to different segments of your audience. For example, you might discover that mobile users from a particular country have a higher bounce rate, indicating a need to optimize your mobile experience for that region.
By connecting Google Sheets and filtering your traffic reports, you can focus on the data that's most relevant to your goals and make informed decisions to improve your website's performance.
Use Bardeen to add ChatGPT to Google Sheets. Quickly summarize or analyze your traffic data within your reports, saving you time and boosting your insights.
Utilizing Advanced Features for Detailed Analysis
HubSpot's Traffic Analytics tool offers advanced features that enable you to perform a deeper analysis of your website's performance. Here's how to leverage these features:
Examine the behavior flow by navigating to the "Behavior" tab in your traffic analytics report. This visualization shows how users move through your site, revealing the most common paths and potential drop-off points.
Analyze conversion paths by clicking on the "Conversions" tab. This report displays the series of interactions that led to a conversion, helping you identify the most effective touchpoints in the customer journey.
Integrate HubSpot with other tools, such as Google Search Console or Hotjar, to expand your data analysis capabilities. These integrations provide additional insights, such as search query data or heatmaps, directly within your HubSpot dashboard.
Utilizing advanced features like behavior flow and conversion path analysis allows you to pinpoint areas for improvement and optimize your website for better user experience and higher conversion rates. Additionally, integrating HubSpot with other tools expands your data analysis capabilities, enabling you to:
View A/B testing results alongside your traffic data to determine which variations drive the best performance
Monitor real-time data to quickly identify and address any issues or opportunities
Gain a more comprehensive understanding of user behavior and preferences
By leveraging these advanced features and integrations, you can make data-driven decisions that enhance your website's performance and drive business growth.
SOC 2 Type II, GDPR and CASA Tier 2 and 3 certified — so you can automate with confidence at any scale.
Frequently asked questions
What is Bardeen?
Bardeen is an automation and workflow platform designed to help GTM teams eliminate manual tasks and streamline processes. It connects and integrates with your favorite tools, enabling you to automate repetitive workflows, manage data across systems, and enhance collaboration.
What tools does Bardeen replace for me?
Bardeen acts as a bridge to enhance and automate workflows. It can reduce your reliance on tools focused on data entry and CRM updating, lead generation and outreach, reporting and analytics, and communication and follow-ups.
Who benefits the most from using Bardeen?
Bardeen is ideal for GTM teams across various roles including Sales (SDRs, AEs), Customer Success (CSMs), Revenue Operations, Sales Engineering, and Sales Leadership.
How does Bardeen integrate with existing tools and systems?
Bardeen integrates broadly with CRMs, communication platforms, lead generation tools, project and task management tools, and customer success tools. These integrations connect workflows and ensure data flows smoothly across systems.
What are common use cases I can accomplish with Bardeen?
Bardeen supports a wide variety of use cases across different teams, such as:
Sales: Automating lead discovery, enrichment and outreach sequences. Tracking account activity and nurturing target accounts.
Customer Success: Preparing for customer meetings, analyzing engagement metrics, and managing renewals.
Revenue Operations: Monitoring lead status, ensuring data accuracy, and generating detailed activity summaries.
Sales Leadership: Creating competitive analysis reports, monitoring pipeline health, and generating daily/weekly team performance summaries.