If you track investments, try Bardeen's AI web scraper. It can scrape and monitor dividend data from any website and sync it with Google Sheets.
Tracking dividend data is crucial for investors seeking to optimize their portfolio and make informed decisions. In this step-by-step guide, we'll walk you through the process of importing dividend data into Google Sheets, from setting up your spreadsheet to automating updates using powerful tools and techniques. Whether you're a seasoned investor or just starting out, this guide will provide you with the knowledge and skills needed to effectively monitor and analyze dividend information.
Understanding Dividend Data and Its Importance
Dividend data provides critical insights for investors seeking to optimize their portfolios and make informed decisions. Key terms to understand include:
Dividend yield: The percentage return on a stock based on its dividend payments relative to its current share price.
Ex-dividend date: The cutoff date by which an investor must own the stock to receive the next dividend payment.
Dividend payout ratio: The proportion of a company's earnings paid out as dividends to shareholders.
Tracking dividend data is essential for several reasons:
It helps identify companies with a strong track record of returning value to shareholders through consistent dividend payments.
Dividend growth can signal a company's financial health and future prospects.
Comparing dividend yields across stocks and sectors aids in portfolio diversification and optimization.
By closely monitoring dividend data, investors can make more strategic decisions, assess the stability and growth potential of their investments, and ultimately build a more robust, income-generating portfolio.
Setting Up Google Sheets for Dividend Tracking
To effectively track your dividend investments, create a well-organized Google Sheets spreadsheet. Start by setting up columns for essential information:
Stock ticker symbol
Company name
Purchase date
Number of shares owned
Purchase price per share
Dividend payment dates
Dividend amount per share
Consider adding additional columns for calculated metrics such as:
Total dividend income per stock
Annualized dividend yield
Total portfolio income
To save time, you can use pre-built templates like the Dividend Tracking Spreadsheet. These templates often include pre-formatted columns, formulas, and visual elements to help you get started quickly. If you want to streamline further, try to bring AI into your spreadsheet for more efficiency.
Customize the template to fit your specific needs and preferences, and be sure to keep your spreadsheet updated regularly with new dividend information and purchases to maintain accurate tracking.
Using Third-Party Add-Ons for Enhanced Data Import
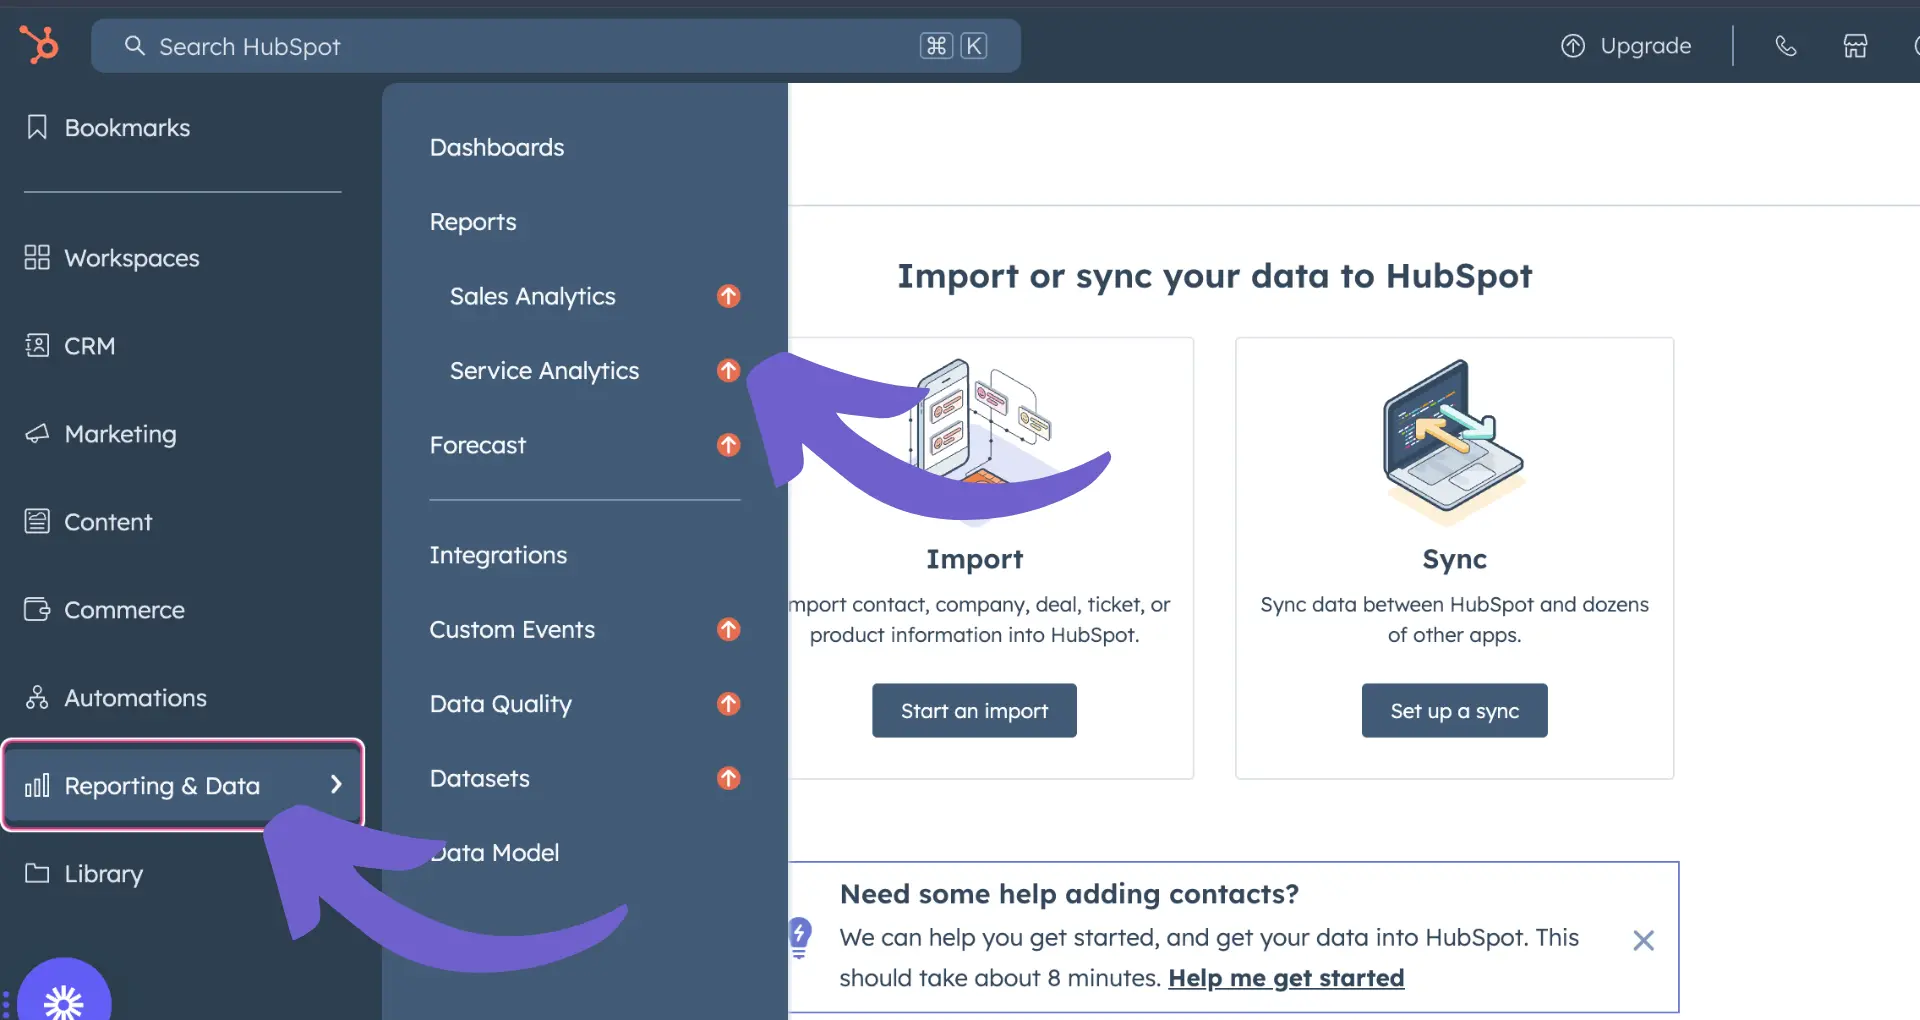
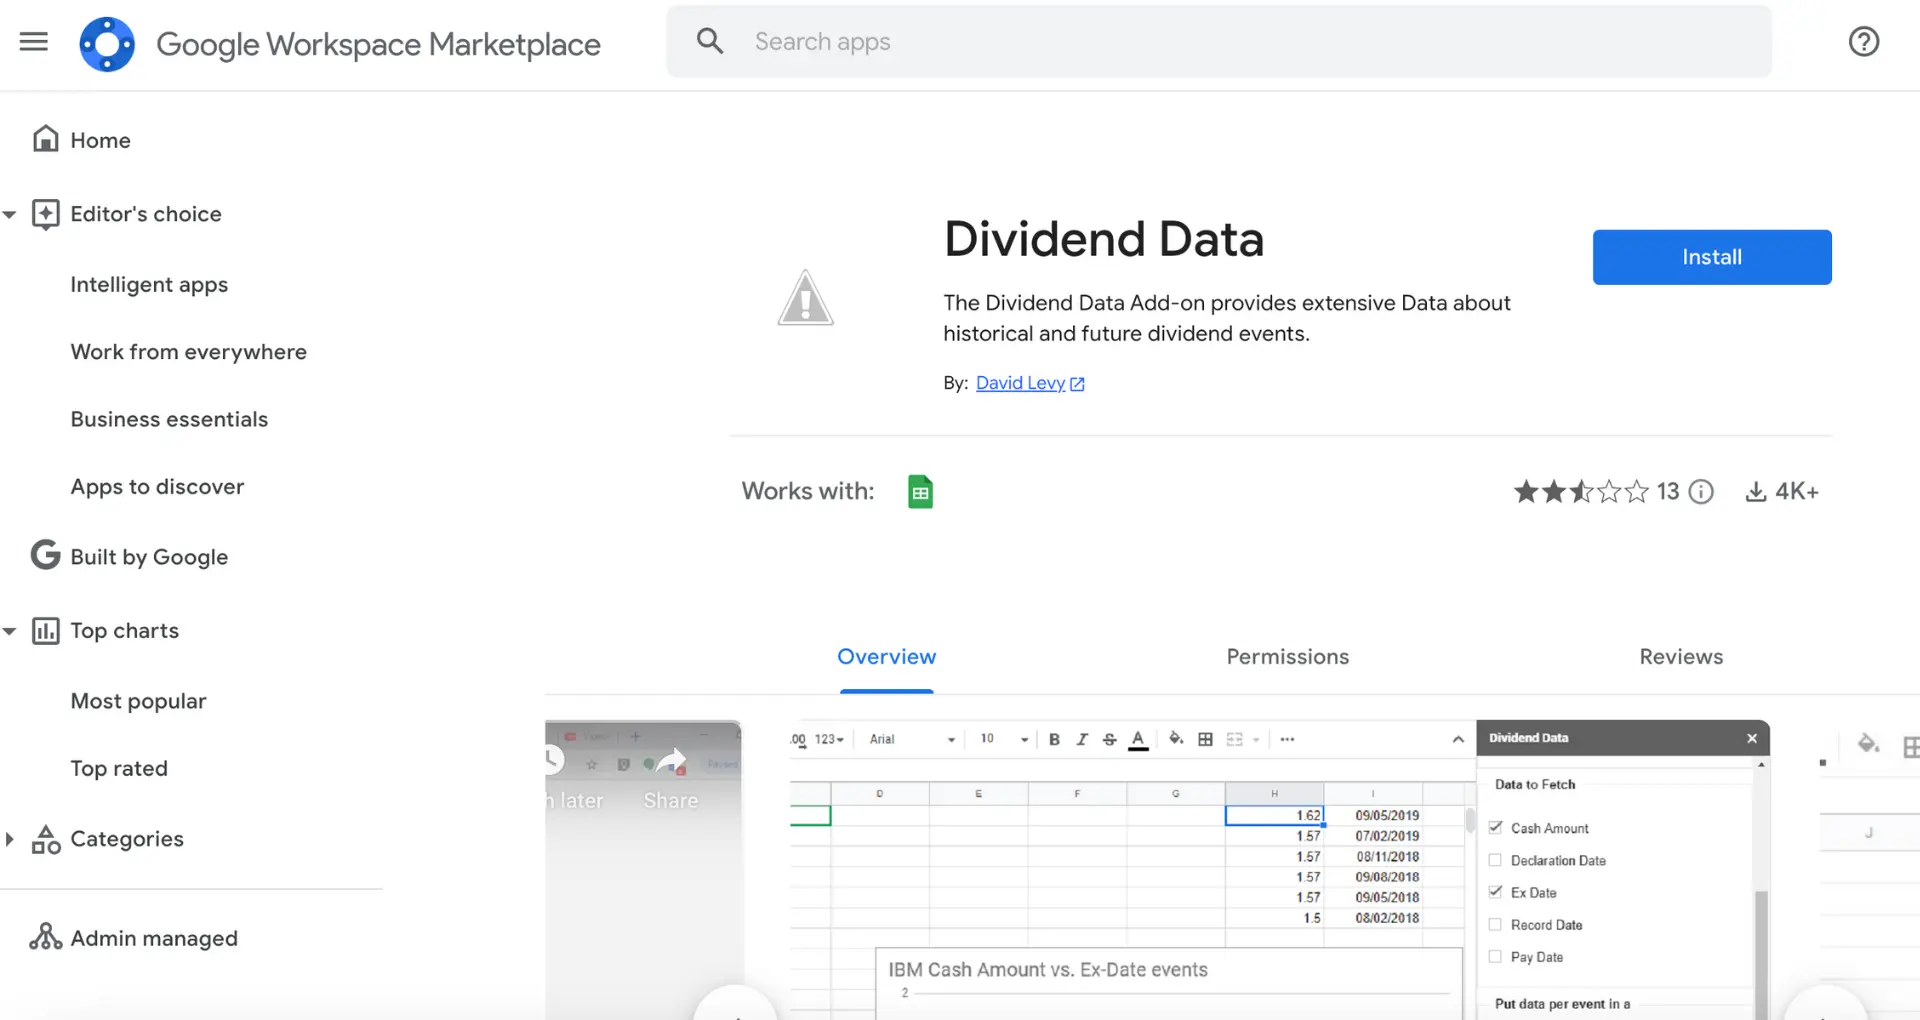
Third-party add-ons from the Google Workspace Marketplace can significantly enhance your data import capabilities in Google Sheets. These add-ons automate the retrieval of detailed information, such as historical dividends and future projections, saving you time and effort. For even more power, you can connect Google Sheets with other tools to streamline your workflow.
To install an add-on:
Open your Google Sheets spreadsheet
Click on "Extensions" in the menu bar
Select "Add-ons" and then "Get add-ons"
Search for the desired add-on (e.g., "Dividend Data" or "Wisesheets")
Click on the add-on and then click "Install"
Grant necessary permissions for the add-on to access your spreadsheet
Once installed, you can access the add-on's features by clicking on "Extensions," selecting the add-on, and then choosing the desired function.
Popular add-ons for dividend data import include:
Dividend Data: Automatically retrieves historical dividend information and future projections for specified stocks
Wisesheets: Imports financial data, including dividends, from various sources and performs calculations and analysis
By leveraging these powerful add-ons, you can streamline your dividend tracking process and gain access to valuable insights without manual data entry.
Manual Methods: Importing Data from Financial Websites
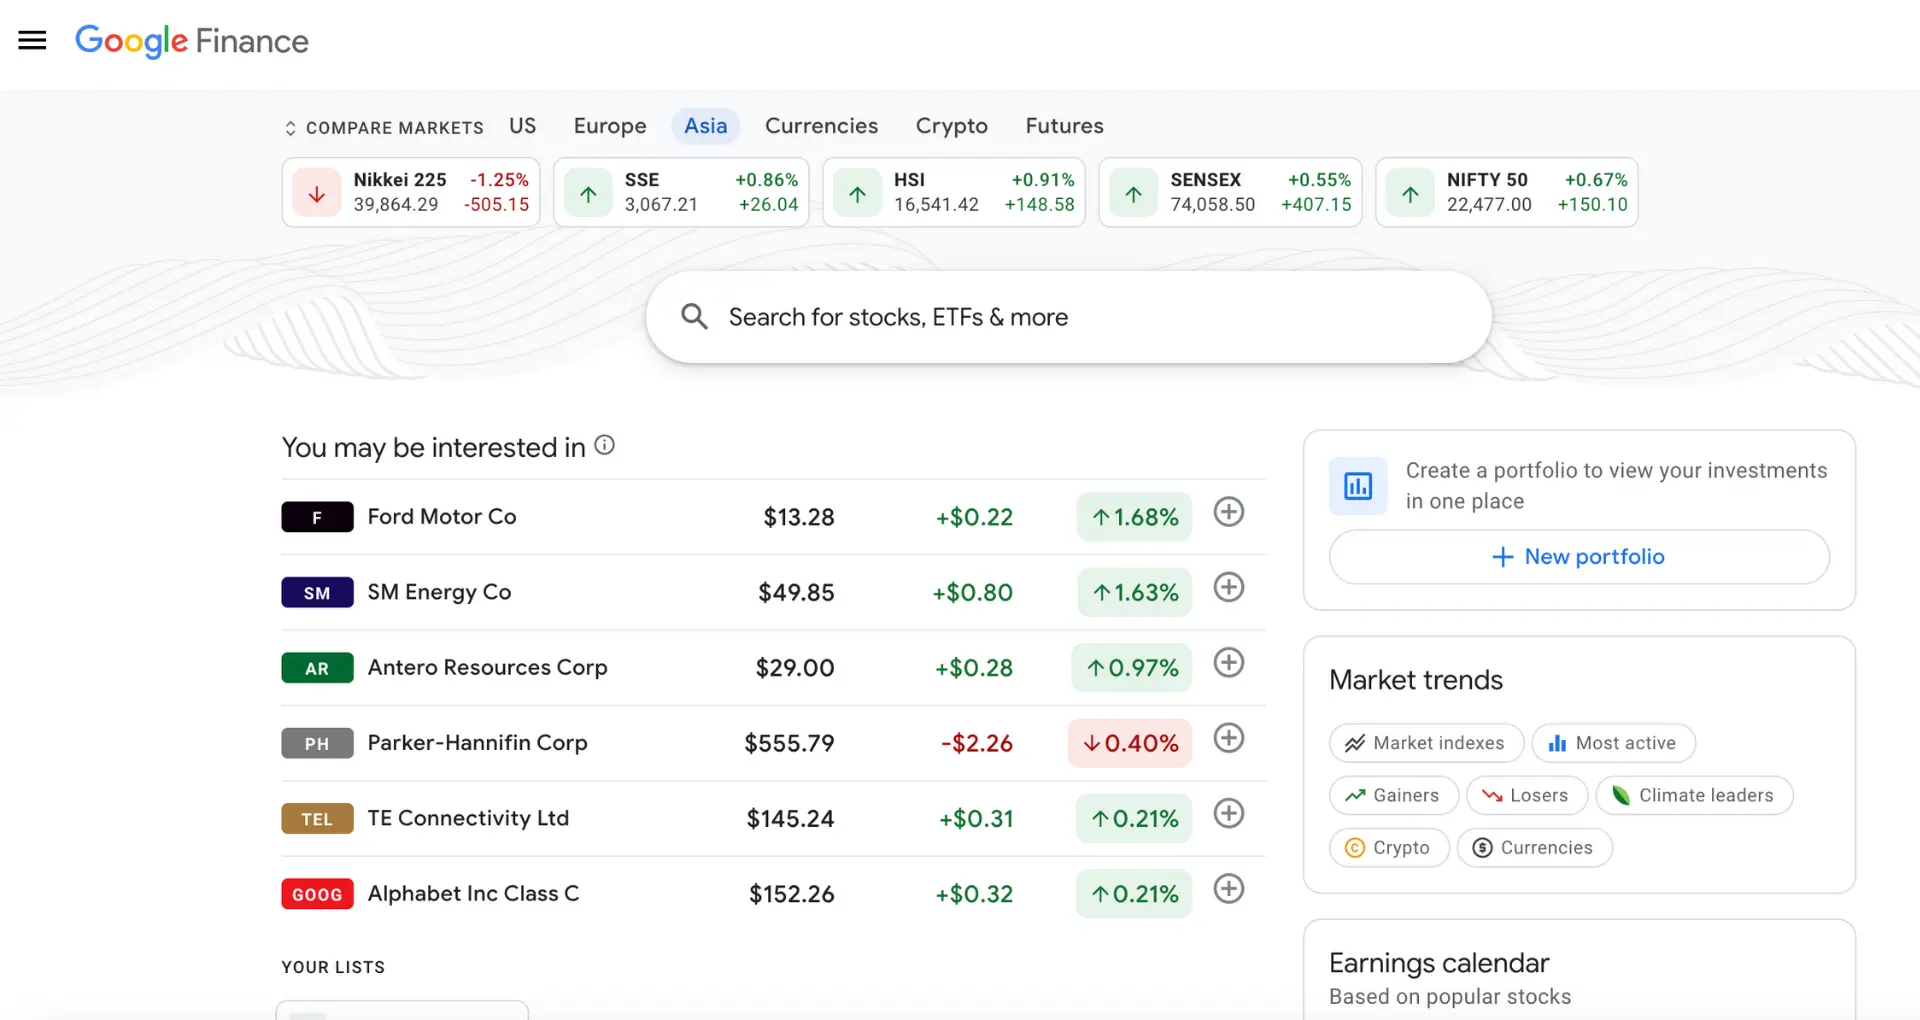
In addition to using third-party add-ons, you can manually import dividend data into Google Sheets using built-in functions like IMPORTHTML or IMPORTXML. These functions allow you to scrape data from financial websites and bring it directly into your spreadsheet.
To use IMPORTHTML:
Find a website with a table containing the desired dividend data (e.g., Yahoo Finance)
Copy the URL of the webpage
In your Google Sheets cell, enter the formula: =IMPORTHTML("URL","table",index)
Replace "URL" with the copied webpage URL
Replace "index" with the position of the table on the page (usually 1 for the first table)
Press Enter, and the data will populate in your spreadsheet
To use IMPORTXML:
Find a website with dividend data in a specific XML path
Copy the URL of the webpage
Inspect the page to find the XML path (right-click on the data and select "Inspect")
In your Google Sheets cell, enter the formula: =IMPORTXML("URL","XPATH")
Replace "URL" with the copied webpage URL
Replace "XPATH" with the copied XML path
Press Enter, and the data will populate in your spreadsheet
Keep in mind that these manual methods may require updating the formulas if the website structure changes. Nonetheless, they provide a quick way to import dividend data without relying on external tools.
Speed up this process using Bardeen's free AI web scraper. This tool can scrape and monitor data from any website and sync it with Google Sheets. Save time and automate these repetitive tasks easily.
Automating Dividend Data Updates and Alerts
To further streamline your dividend tracking process in Google Sheets, you can use Google Apps Script to automate data updates and set up alerts for dividend changes or new announcements.
Open your Google Sheets and go to "Tools" > "Script editor"
In the script editor, create a new function (e.g., "updateDividendData") that uses the built-in functions like IMPORTHTML or IMPORTXML to fetch the latest dividend data from your preferred financial website
Set up a trigger to run the function automatically on a schedule (e.g., daily or weekly) by clicking on the clock icon in the script editor and configuring the desired frequency
Save the script and let it run automatically to keep your dividend data up-to-date
To set up alerts for dividend changes or new announcements, you can modify the script to:
Compare the newly fetched data with the existing data in your spreadsheet
If there are any changes or new entries detected, send an email alert using the MailApp.sendEmail() function
Here's a simple code snippet to get you started:
function updateDividendData() { var sheet = SpreadsheetApp.getActiveSheet(); var newData = IMPORTXML("URL", "XPATH"); var oldData = sheet.getRange("A1").getValue(); if (newData != oldData) { sheet.getRange("A1").setValue(newData); MailApp.sendEmail("youremail@example.com", "Dividend Update Alert", "There has been a change in the dividend data."); } }
Remember to replace "URL" and "XPATH" with the appropriate values for your chosen financial website, and customize the email settings according to your preferences.
By automating dividend data updates and alerts using Google Apps Script, you can save time and ensure that you always have the most current information for your investment decisions. You can also automate other tasks to make your workflow more efficient.
SOC 2 Type II, GDPR and CASA Tier 2 and 3 certified — so you can automate with confidence at any scale.
Frequently asked questions
What is Bardeen?
Bardeen is an automation and workflow platform designed to help GTM teams eliminate manual tasks and streamline processes. It connects and integrates with your favorite tools, enabling you to automate repetitive workflows, manage data across systems, and enhance collaboration.
What tools does Bardeen replace for me?
Bardeen acts as a bridge to enhance and automate workflows. It can reduce your reliance on tools focused on data entry and CRM updating, lead generation and outreach, reporting and analytics, and communication and follow-ups.
Who benefits the most from using Bardeen?
Bardeen is ideal for GTM teams across various roles including Sales (SDRs, AEs), Customer Success (CSMs), Revenue Operations, Sales Engineering, and Sales Leadership.
How does Bardeen integrate with existing tools and systems?
Bardeen integrates broadly with CRMs, communication platforms, lead generation tools, project and task management tools, and customer success tools. These integrations connect workflows and ensure data flows smoothly across systems.
What are common use cases I can accomplish with Bardeen?
Bardeen supports a wide variety of use cases across different teams, such as:
Sales: Automating lead discovery, enrichment and outreach sequences. Tracking account activity and nurturing target accounts.
Customer Success: Preparing for customer meetings, analyzing engagement metrics, and managing renewals.
Revenue Operations: Monitoring lead status, ensuring data accuracy, and generating detailed activity summaries.
Sales Leadership: Creating competitive analysis reports, monitoring pipeline health, and generating daily/weekly team performance summaries.