Create Stock Charts in Google Sheets: A Step-by-Step Guide

LAST UPDATED
June 6, 2024
Jason Gong
TL;DR

Use GOOGLEFINANCE to fetch live stock data in Google Sheets.

By the way, we're Bardeen, we build a free AI Agent for doing repetitive tasks.

If you're analyzing stock data, you might love Bardeen's GPT in Spreadsheets feature. It automates data import and visualization, saving you time and effort.

Tracking stock performance is crucial for investors and financial analysts. While there are many tools available, Google Sheets offers a powerful and accessible solution for importing and visualizing stock charts. In this step-by-step guide, we'll walk you through the process of setting up your Google Sheets to easily import live stock data and create dynamic charts for effective market analysis.

Understanding the Basics of Google Sheets and Stock Charts

Before diving into importing stock charts, it's essential to grasp the fundamental concepts of Google Sheets relevant to financial data management. Google Sheets is a powerful spreadsheet tool that allows you to organize, analyze, and visualize data efficiently. You can even integrate Google Sheets with other tools for better data management.

When it comes to stock charts, there are several common types to be familiar with:

  • Line Chart: Displays the price movement of a stock over time, connecting data points with a line. Ideal for identifying trends and patterns.
  • Bar Chart: Represents stock prices or trading volumes using vertical or horizontal bars. Useful for comparing data across different time periods or stocks.
  • Candlestick Chart: Shows the open, high, low, and close prices of a stock for a specific period. Each "candle" represents these four data points, providing insights into price movements and market sentiment.

Understanding these chart types and their applications in market analysis will help you choose the most appropriate one for your needs when visualizing stock data in Google Sheets.

For advanced data handling, consider using GPT for Google Sheets to bring AI capabilities into your spreadsheets.

Setting Up Your Google Sheets for Stock Data Import

Before you start importing stock data into Google Sheets, it's crucial to set up your spreadsheet properly. This will streamline data management and make it easier to update and analyze the information.

Here are the preliminary steps to prepare your Google Sheets:

  1. Create a new Google Sheets document or open an existing one where you want to import the stock data.
  2. Decide on a clear and consistent naming convention for your sheet tabs, such as "Stock Data" or "Portfolio Performance." This will help you navigate and locate information quickly.
  3. Set up your sheet layout by creating column headers for the data you want to track, such as "Ticker Symbol," "Date," "Open Price," "Close Price," "Volume," etc.
  4. Consider creating separate sheets for different stock portfolios, time periods, or analysis purposes to keep your data organized and easily accessible.

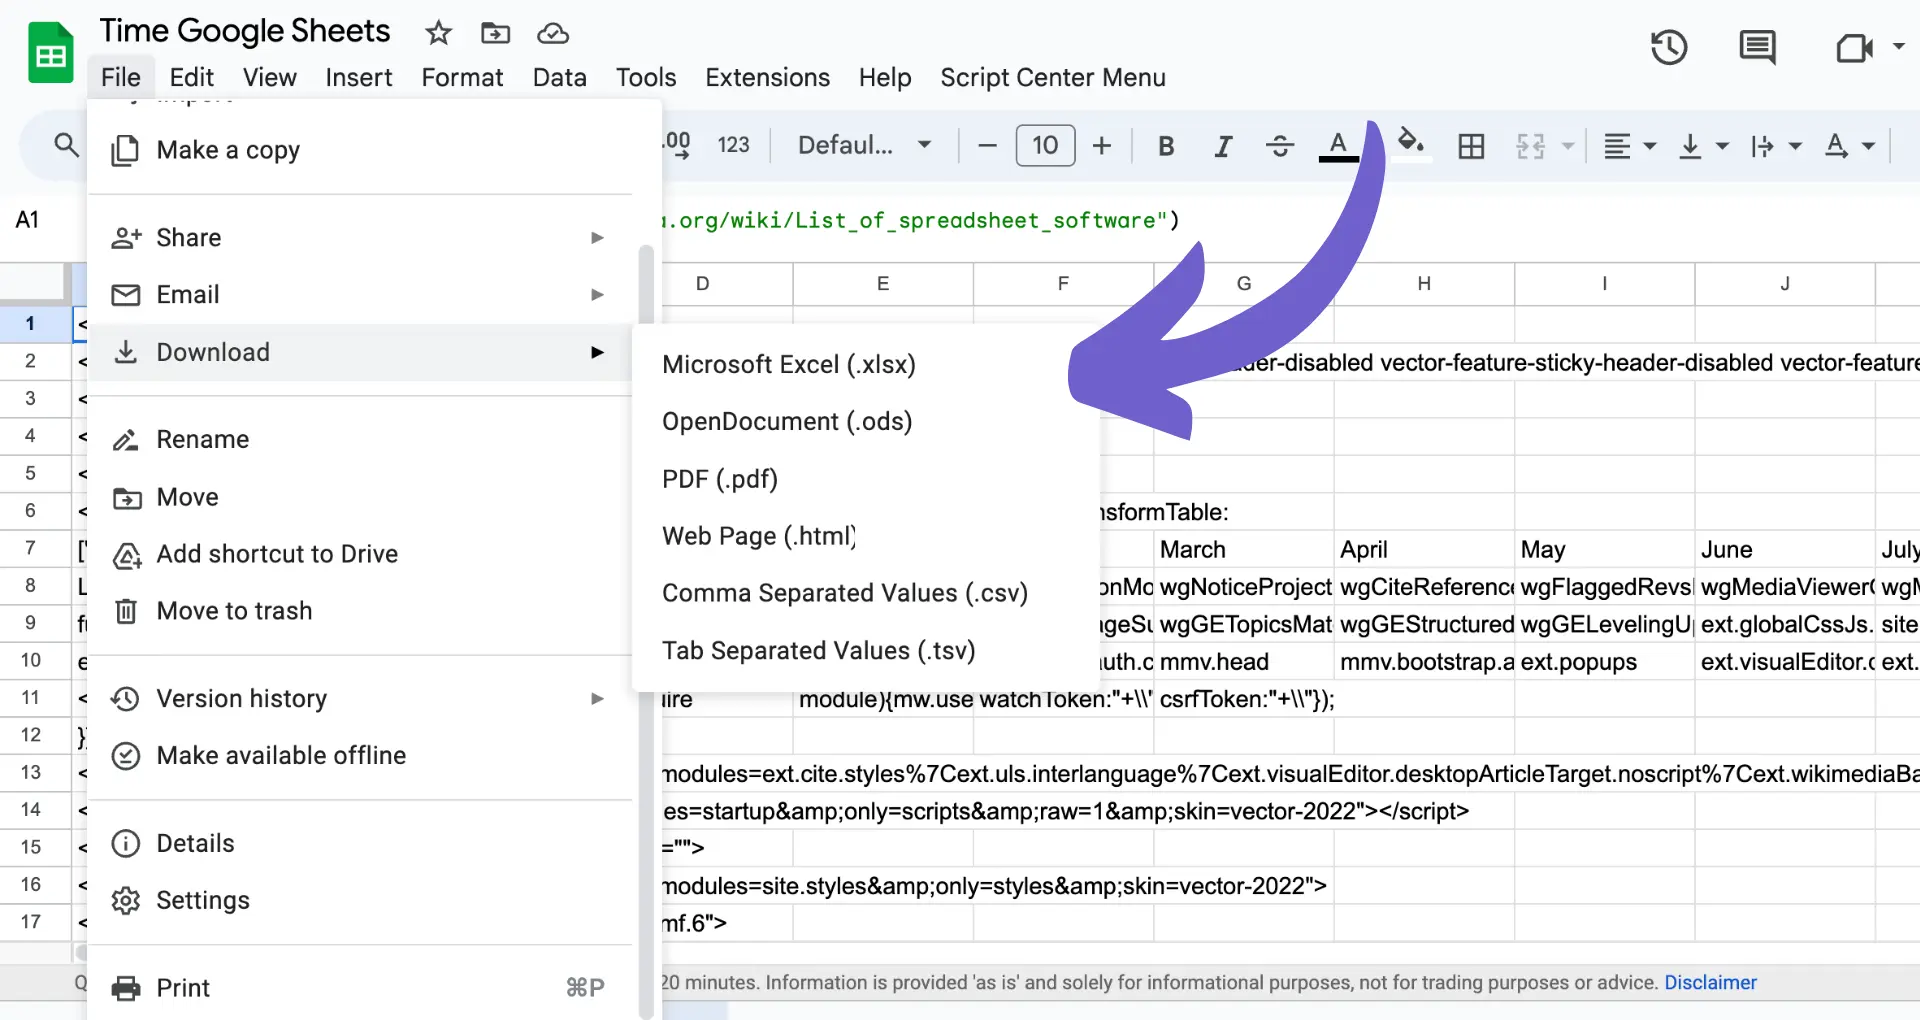
By taking the time to properly set up your Google Sheets, you'll be able to import and manage your stock data more efficiently. A well-structured spreadsheet will also make it easier to create visually appealing and informative stock charts later on. To further enhance your setup, look into tools that can scrape data from websites.

Save time by connecting Microsoft Excel to automate tasks. Let Bardeen handle repetitive actions so you can focus on important analysis.

Utilizing GOOGLEFINANCE Function for Live Data

The GOOGLEFINANCE function in Google Sheets allows you to fetch real-time stock prices and historical market data directly into your spreadsheet. This powerful function eliminates the need for manual data entry and ensures your stock data is always up-to-date.

To use the GOOGLEFINANCE function, follow this syntax:

GOOGLEFINANCE(ticker, [attribute], [start_date], [end_date|num_days], [interval])

  • ticker: The ticker symbol for the security you want to track. Make sure to include both the exchange symbol and ticker symbol, such as "NASDAQ:GOOG" for Google stock.
  • attribute (optional): The specific data point you want to fetch, such as "price," "volume," or "marketcap." If not specified, the default is "price."
  • start_date (optional): The start date for fetching historical data. If specified without an end_date or num_days, only data for that single day will be returned.
  • end_date|num_days (optional): The end date for fetching historical data or the number of days from the start_date for which to return data.
  • interval (optional): The frequency of returned data, either "DAILY" or "WEEKLY." You can also use 1 for daily or 7 for weekly.

Here's an example of how to use the GOOGLEFINANCE function to fetch the current price of Apple stock:

=GOOGLEFINANCE("NASDAQ:AAPL", "price")

To retrieve historical data, you can specify a date range:

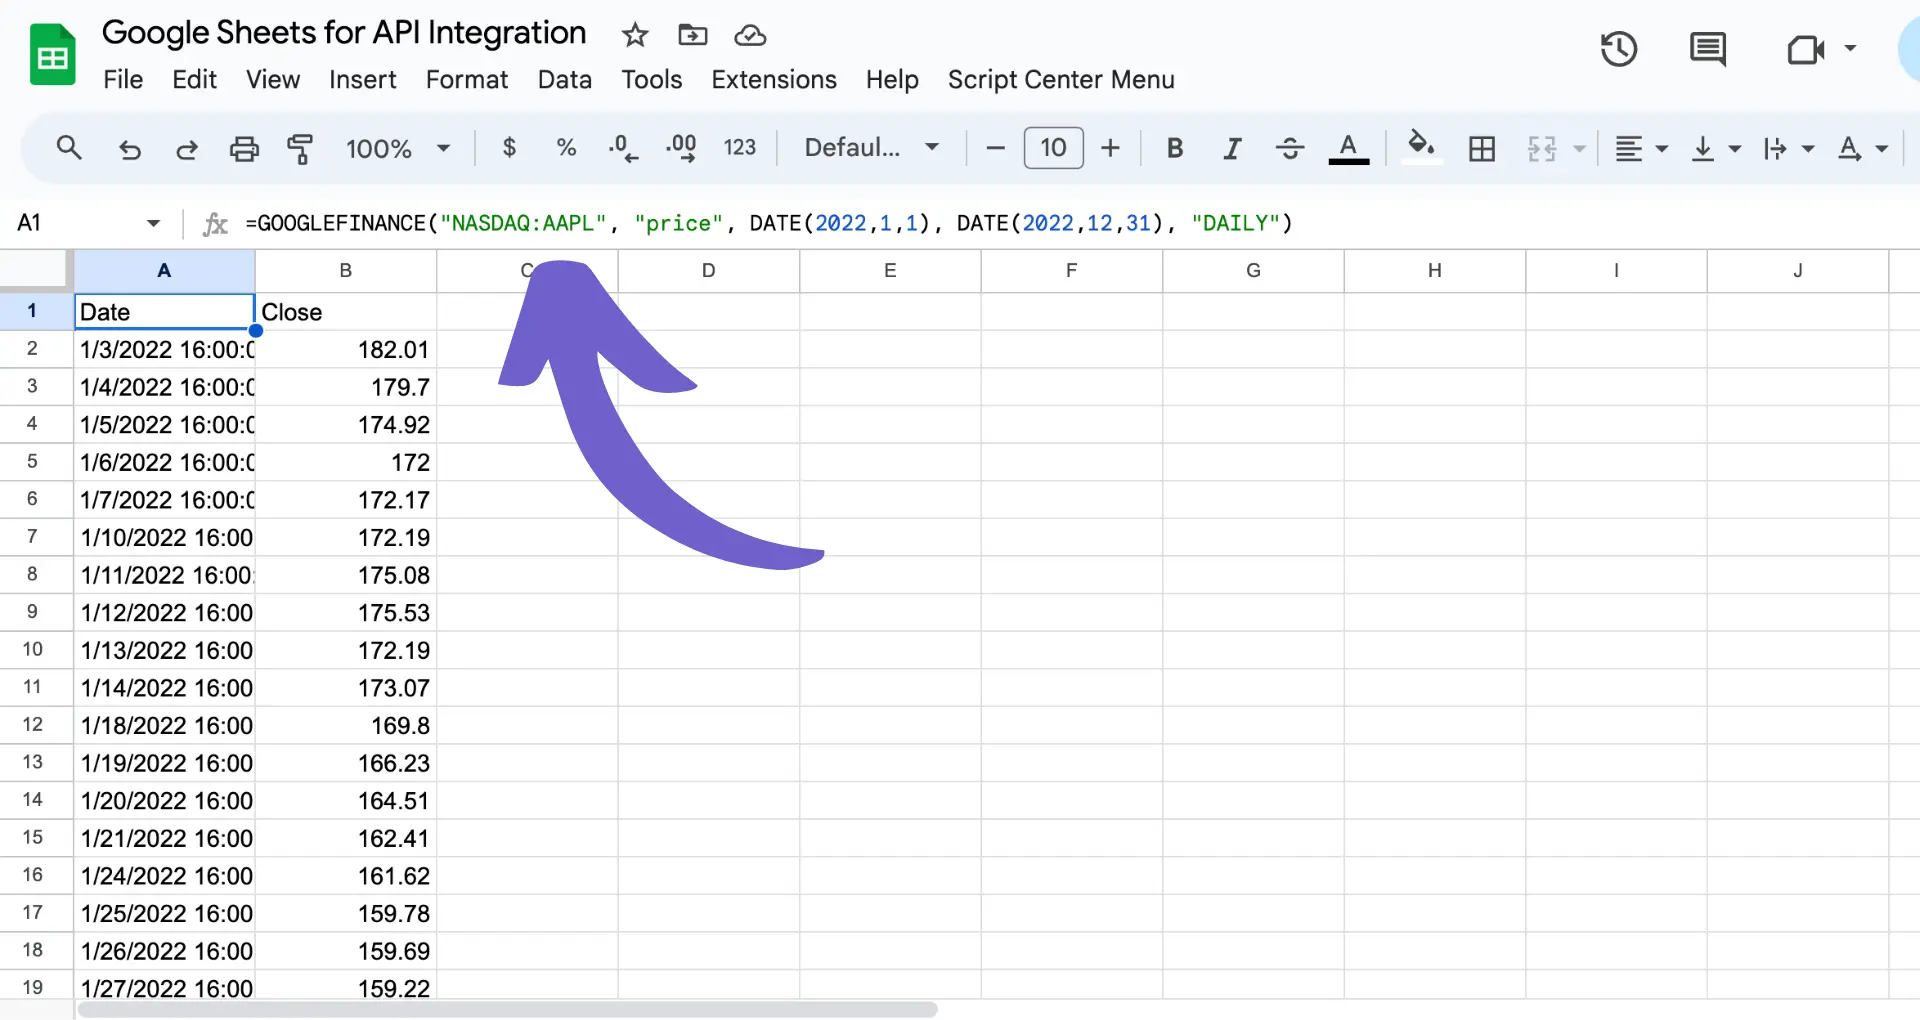
=GOOGLEFINANCE("NASDAQ:AAPL", "price", DATE(2022,1,1), DATE(2022,12,31), "DAILY")

This will return an array of daily stock prices for Apple from January 1, 2022, to December 31, 2022.

By mastering the GOOGLE FINANCE function, you can easily import live and historical stock data into your Google Sheets, enabling you to analyze and visualize the information effectively. For more advanced automation, consider using Bardeen's AI Web Scraper.

Importing and Displaying Stock Charts in Google Sheets

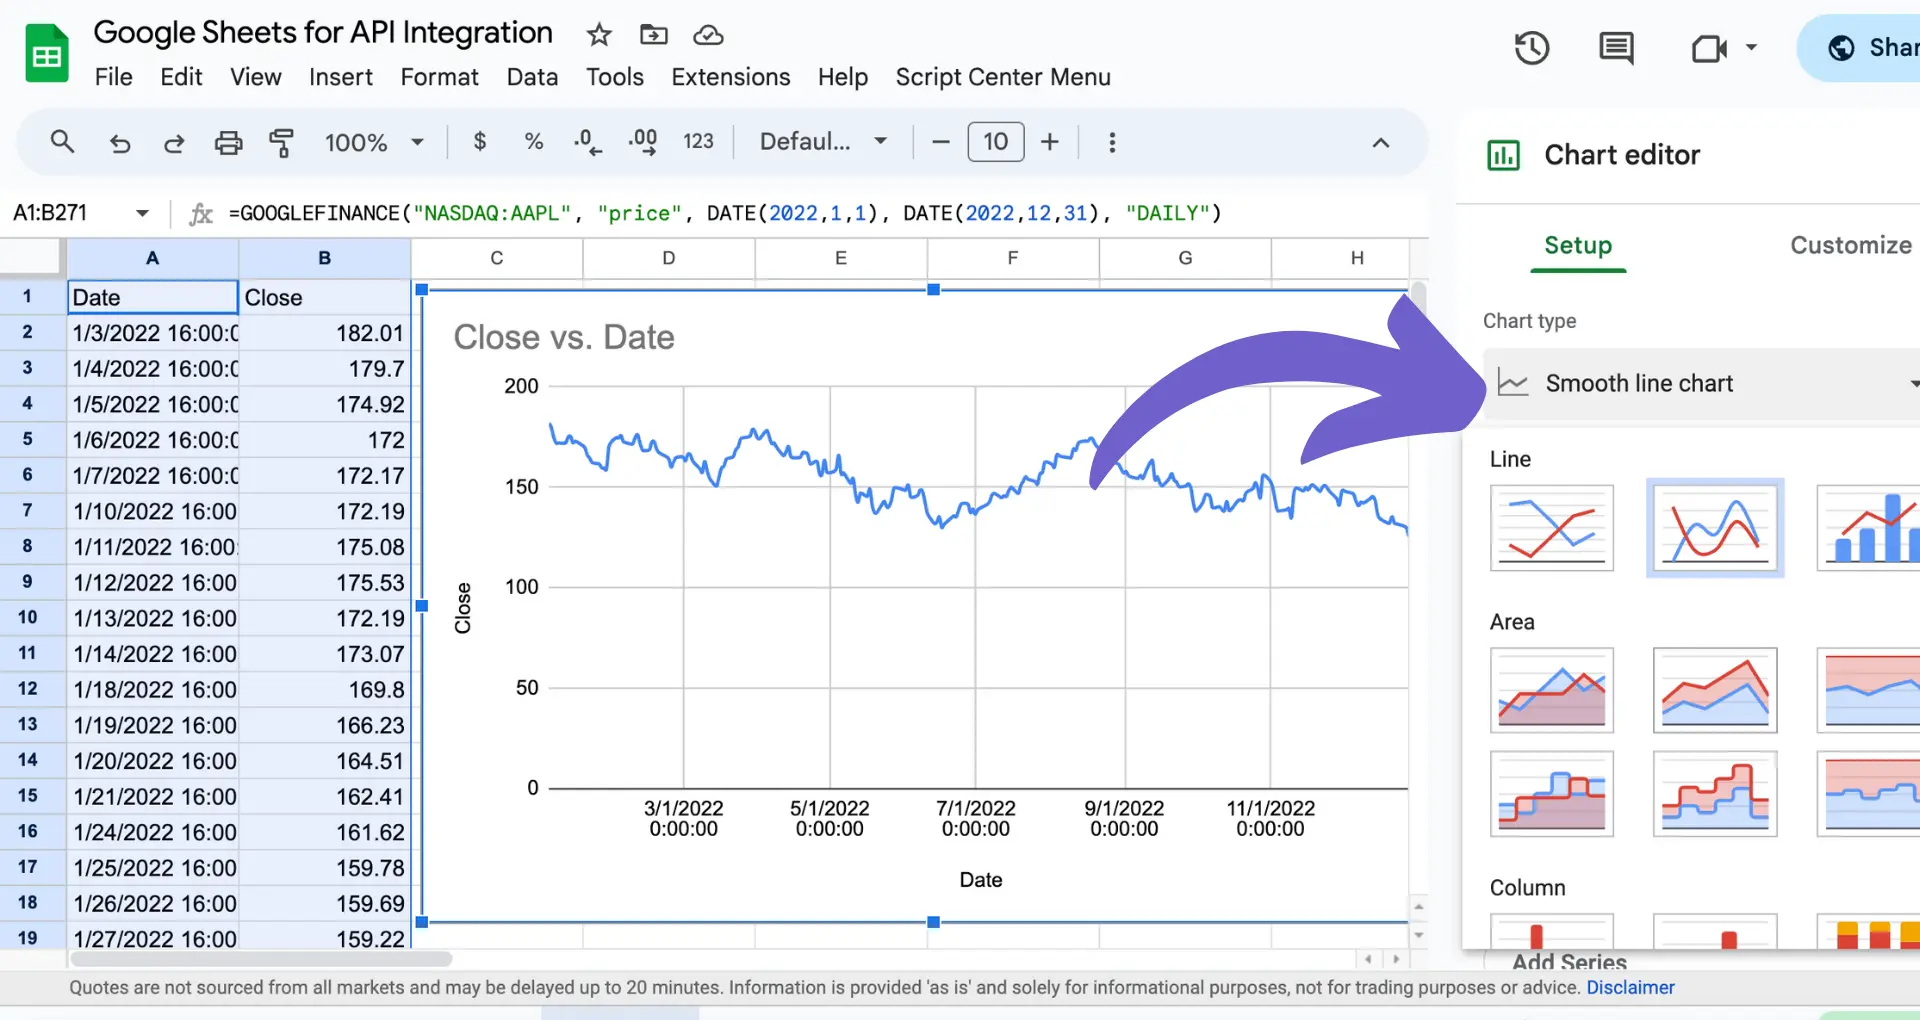
Once you have imported stock data using the GOOGLE FINANCE function, you can create dynamic charts to visualize the information effectively. Google Sheets offers various chart types suitable for displaying stock data, such as line charts, bar charts, and candlestick charts.

To create a stock chart in Google Sheets, follow these steps:

  1. Ensure your stock data is organized in a structured format, with columns for dates, prices, and other relevant information.
  2. Select the data range you want to include in the chart.
  3. Click on the "Insert" menu and choose "Chart" to open the Chart Editor.
  4. In the Chart Editor, select the appropriate chart type for your stock data. For example, choose a line chart to show price trends over time or a candlestick chart to display open, high, low, and close prices.
  5. Customize the chart elements, such as titles, labels, and colors, to enhance readability and visual appeal.
  6. Click "Insert" to place the chart in your Google Sheets.

When creating candlestick charts, ensure your data is formatted correctly. The first column should contain dates, followed by columns for the high, low, open, and close prices. This chart type is particularly useful for analyzing price movements and patterns over a specific period.

To further customize your stock charts, you can:

  • Adjust the chart size and position to fit your spreadsheet layout.
  • Add trend lines or moving averages to identify long-term trends or smooth out price fluctuations.
  • Use data labels or annotations to highlight key data points or events.
  • Apply conditional formatting to the data range to visually emphasize specific values or changes.

By creating dynamic stock charts in Google Sheets, you can gain valuable insights into price movements, identify trends, and make informed investment decisions. Regularly updating your stock data using the GOOGLE FINANCE function ensures your charts always reflect the most current information. For more advanced charting options, consider bringing AI into your spreadsheet to automate and enhance your data analysis.

Use Bardeen's integration to connect Google Docs and streamline your data updates. This will save you time and keep your information organized and up-to-date.

Advanced Tips and Troubleshooting Common Issues

To optimize your stock chart imports and streamline your workflow, consider the following advanced tips:

  • Use Google Apps Script to automate data fetching and chart updates. You can create custom functions or set up triggers to refresh data at specific intervals, ensuring your charts always display the most recent information.
  • Integrate your Google Sheets with other data sources, such as financial APIs or external databases, to enrich your stock data and gain additional insights. You can use built-in functions like IMPORTDATA or write custom scripts to pull data from various sources.
  • Implement data validation and error handling techniques to ensure data integrity and prevent issues like incorrect ticker symbols or missing data points. Use functions like IFERROR or IFNA to handle errors gracefully and provide fallback values.

When working with stock charts in Google Sheets, you may encounter common issues such as:

  1. Data fetching errors: If the GOOGLEFINANCE function returns "#N/A" or "#ERROR!", double-check the ticker symbol and the specified date range. Ensure the stock is actively traded and the data is available for the requested period.
  2. Incorrect chart display: If your chart appears distorted or doesn't reflect the expected data, verify that your data range is properly formatted and contains the necessary columns for the selected chart type. Check for any missing or inconsistent data points that may affect the chart's appearance.
  3. Performance issues: When working with large datasets or complex charts, you may experience slower performance or lag. Optimize your spreadsheet by removing unnecessary data, using named ranges, and splitting data into separate sheets if needed. Consider using pivot tables or data consolidation techniques to summarize data and reduce the overall size of your spreadsheet.

If you encounter persistent issues or need further assistance, consult the Google Sheets documentation, participate in online forums, or seek help from the Google Sheets community. Many experienced users and experts can provide valuable insights and solutions to common problems.

By leveraging advanced tips and troubleshooting techniques, you can create robust and reliable stock charts in Google Sheets, enabling you to make data-driven decisions and stay on top of your investments. For more advanced automation, check out Bardeen's Automation Field Guide.

Automate Your Finance Analysis with Bardeen in Google Sheets

Importing stock charts into Google Sheets can greatly enhance your ability to analyze financial data. While the manual process involves sourcing data and charting it within Google Sheets, automation can streamline this process, bringing in data from various sources effortlessly.

With Bardeen, you can automate data import tasks, enabling you to focus on analysis rather than data entry. Here are some powerful ways Bardeen can automate your Google Sheets for financial analysis:

  1. Copy all Github issues to Google Sheets: Automate the transfer of GitHub issues into a Google Sheet, perfect for tracking project-related expenses or investments tied to software development.
  2. Export Google Trends Data and Save to Google Sheets: Automatically scrape and save Google Trends data to Google Sheets, aiding in market analysis and investment decision-making by understanding search trends.
  3. Copy TechCrunch articles for a keyword to Google Sheets: Keep up with the latest tech market news by automating the collection of TechCrunch articles related to your investment interests directly into Google Sheets.

By leveraging Bardeen's playbooks, you can significantly reduce manual work, ensuring your Google Sheets are always up-to-date with the latest data relevant to your stock analysis. Get started at Bardeen.ai/download.

Contents
Get real-time stock data with Bardeen AI

Bardeen's AI Agent automates importing and visualizing stock data in Google Sheets.

Get Bardeen free

Related frequently asked questions

Import Web Data to Google Sheets: A Step-by-Step Guide

Learn to import data from websites to Google Sheets using built-in functions, add-ons, and third-party tools for enhanced data analysis and reporting.

Read more
How to Increase Engagement on LinkedIn: 15 Proven Tips

Discover 15 strategies to boost your LinkedIn engagement. Learn how to optimize your profile, craft engaging content, leverage advanced features, and analyze data.

Read more
Export LinkedIn Contacts to Excel & Gmail: A Guide (2024)

Learn how to download or export LinkedIn contacts for Excel and Gmail in 2024. Useful for backing up, analyzing networks, or importing contacts.

Read more
Extract URLs & Links from Google Sheets Easily (5 Steps)

Learn how to extract URLs and links from Google Sheets using formulas, scripts, and add-ons. Open multiple URLs easily with our step-by-step guide.

Read more
Import RSS Feed to Google Sheets: A Step-by-Step Guide

Learn how to import RSS feeds into Google Sheets using IMPORTFEED, and create RSS from Google Sheets using Google Apps Script or Zapier. Efficient data management.

Read more
What is Customer Segmentation? Benefits and Techniques

Discover customer segmentation, its benefits, and advanced techniques. Learn how to divide your customers into distinct groups for tailored marketing strategies.

Read more
how does bardeen work?

Your proactive teammate — doing the busywork to save you time

Integrate your apps and websites

Use data and events in one app to automate another. Bardeen supports an increasing library of powerful integrations.

Perform tasks & actions

Bardeen completes tasks in apps and websites you use for work, so you don't have to - filling forms, sending messages, or even crafting detailed reports.

Combine it all to create workflows

Workflows are a series of actions triggered by you or a change in a connected app. They automate repetitive tasks you normally perform manually - saving you time.

get bardeen

Don't just connect your apps, automate them.

200,000+ users and counting use Bardeen to eliminate repetitive tasks

Effortless setup
AI powered workflows
Free to use
Reading time
Thank you! Your submission has been received!
Oops! Something went wrong while submitting the form.
By clicking “Accept”, you agree to the storing of cookies. View our Privacy Policy for more information.